Data Summary Table
The data summary tables are highly configurable tables that can be used to generate customised summaries of the sample data within a project or organisation.
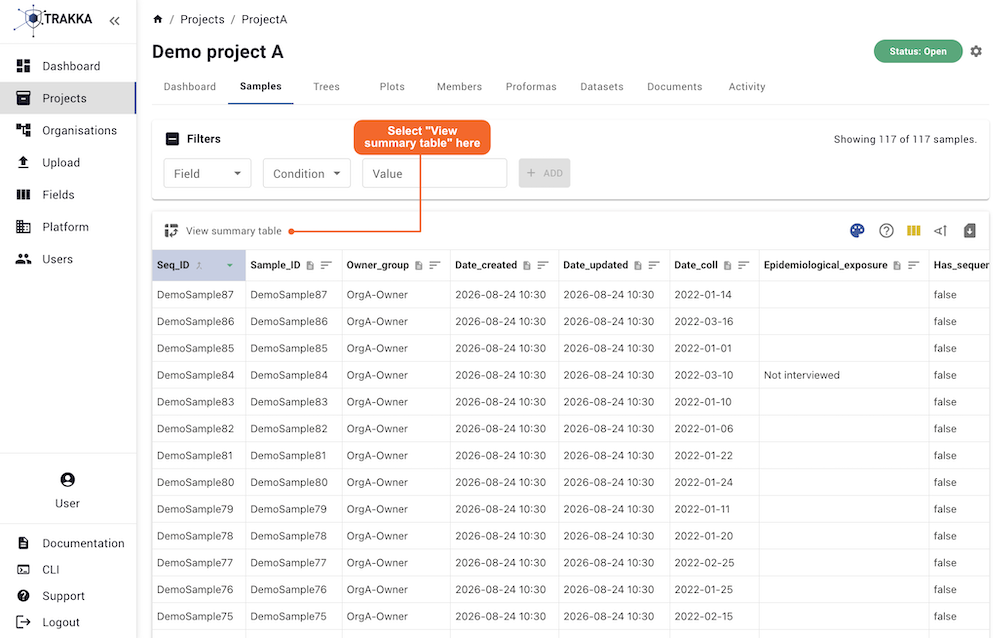
To navigate to the summary table, go to either a Project or Organisation sample table and select View summary table button in the table header. Once the "View summary table" button has been selected, the default summary table view will show a simple count of total records. User can switch back to the raw metadata table by selecting the View raw metadata button.
Note: Switching to the summary table will maintain all filters applied on the sample table, and vice versa.
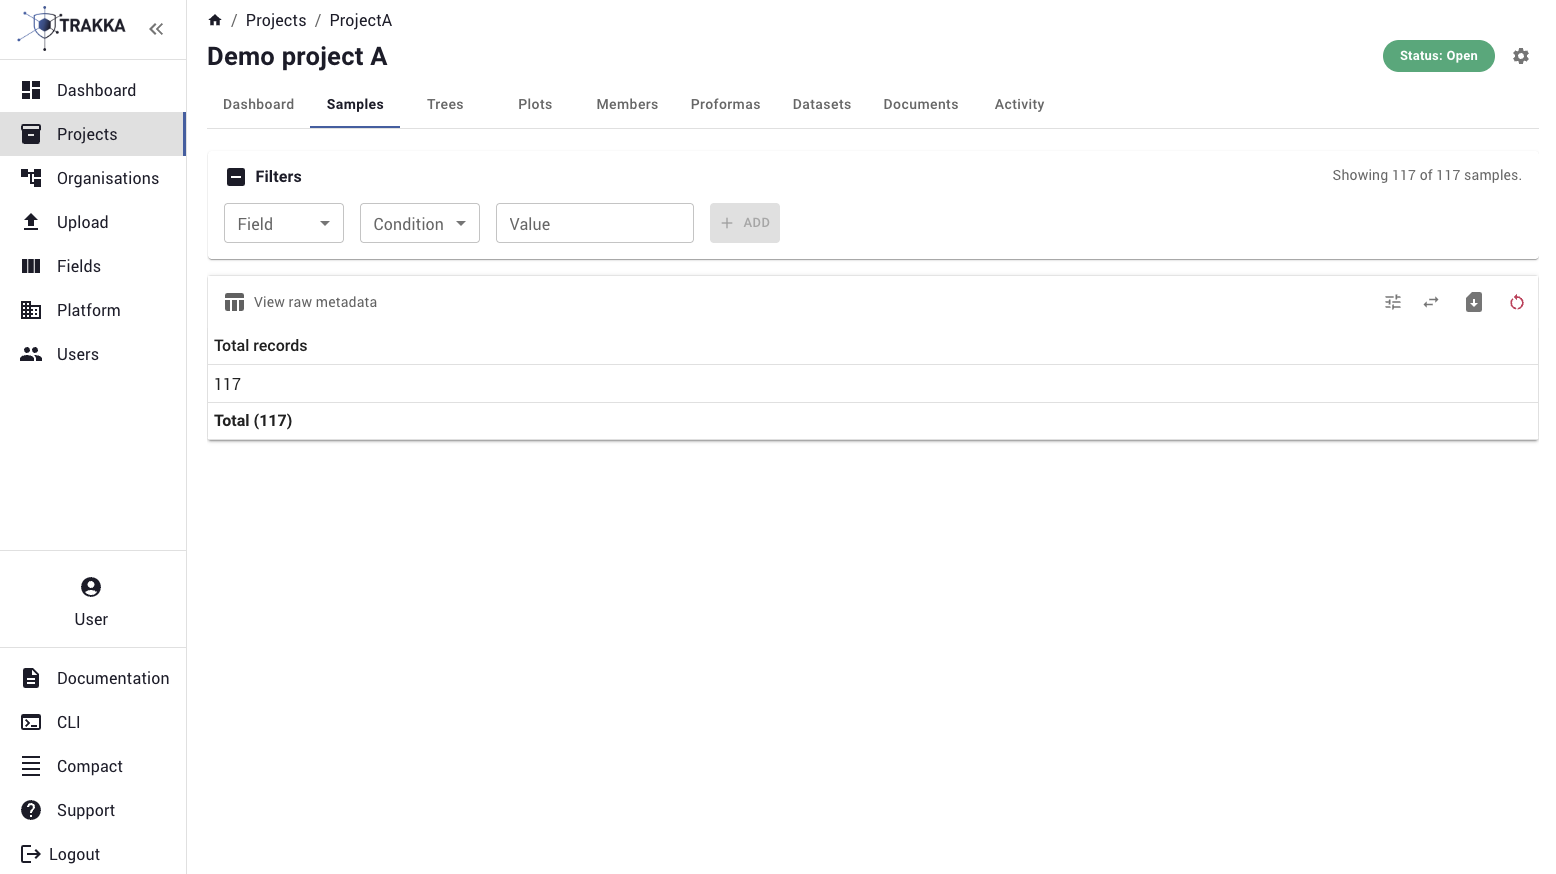
The header of the summary table contains a number of different options:
| Option | Description | |
|---|---|---|
| Configure table fields | Allows you to configure the fields and overall layout of the summary table (see Configuration below for more details) | |
| View display fields as rows or columns | Shows the display fields as either columns or rows, note this is only useful if one or more display fields have been selected | |
| Export table as CSV | Exports the summary table in its current state to CSV | |
| Reset table configuration | Selecting this will reset the table back to the default, which shows the total count of records |
Configuration
Selecting the Configure Table Fields button from the header of the summary table will open a side panel with a number of different configuration options.
Global table options
- Show total footer count: Show total count of records in the footer of the table, this footer is maintained on CSV export of the table.
- Show relative percentages: Selecting this option shows percentages of the cell count relative to the total count of records visible in the table. These percentages are only calculated for row-count metrics (e.g. total count) and are not calculated for other aggregation types (e.g. sum, mean, median).
- Hide empty/null groups: This option hides all groups where one or more group-by fields have empty or null values. Hiding these groups will affect the total counts and relative percentages for other groups within the table. This option will only have a visible effect if there are group-by fields selected, and there are empty/null values for those fields in the dataset.
Display fields
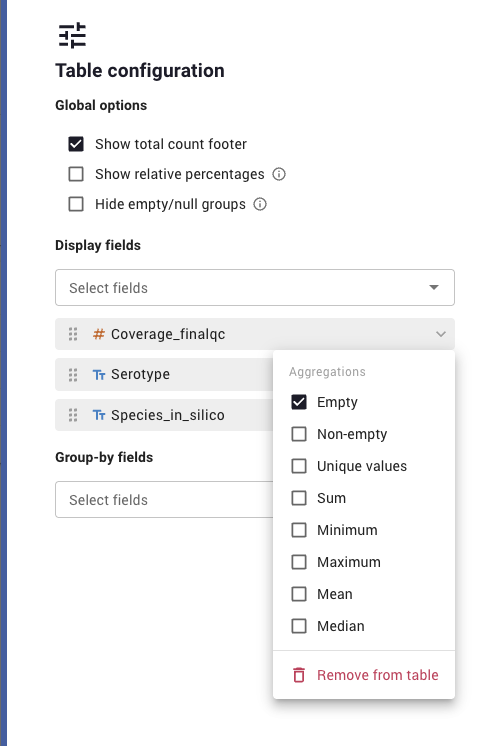
Display fields are used to choose which summary aggregations or calculations are shown for which fields within the dataset. Available aggregations depending on the field's type.
| Aggregation | Meaning | Field type |
|---|---|---|
| Non-empty | Count of records with a value | All fields |
| Empty | Count of records missing a value | All fields |
| Unique values | Count of distinct values | All fields |
| Sum | Total of all values | Number fields |
| Minimum / Maximum | Smallest / largest value | Number fields |
| Mean | Average value | Number fields |
| Median | Middle value | Number fields |
Group-by fields
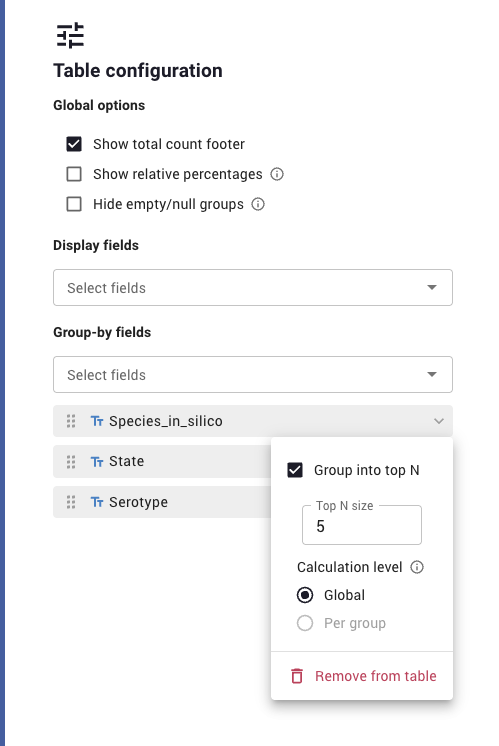
Group-by fields decide how the data is grouped, where each unique combination of values in these fields becomes a row within the table. Group-by fields can individually be further configured, depending on the field type. Below is a summary of what configuration is available for different field types.
| Field type | Configuration | Description |
|---|---|---|
| Date fields | Granularity | Choose how dates are bucketed. Options include Year, Month, Week, or Day. For example, choosing "Month" groups every record for each month together, regardless of the exact day. |
| Number fields | Binning | Spit continuous numeric fields into fixed-size ranges, instead of grouping by every individual value. The default bin size is calculated based on the data present, but can be manually set by inputting a valid number in the Bin size control. |
| All fields (except Boolean) | Top-N grouping | Show only the most common values for a field, collapsing everything else into a single 'Other' group. Set Top N size to control how many top values to keep. This can be combined with binning or date granularity, where Top-N is always applied after binning. See calculation level below for more details about Top-N grouping. |
Top-N Grouping - Calculation level
When you have more than one group-by field, you can choose how Top-N is calculated:
- Global — the same top-N values apply everywhere this field is used, even inside different parent groups.
- Per group — the top-N values are recalculated separately within each parent group, so different parent groups can show different top values. Per group is only available if this isn't the first (or only) group-by field. The first field has no parent group to calculate within, so it always uses Global.
Blank or empty values, which are represented as "-" in the data summary table, compete for a Top-N slot the same as any other value. If most of your records are missing a value for a field, "-" can end up as a top group, separate from Other.
Reordering fields
A field can be dragged up or down within its list, using the handle on the left of each row to reorder it. For group-by fields, the order of the fields is important as it sets the nesting priority of the selected groups.